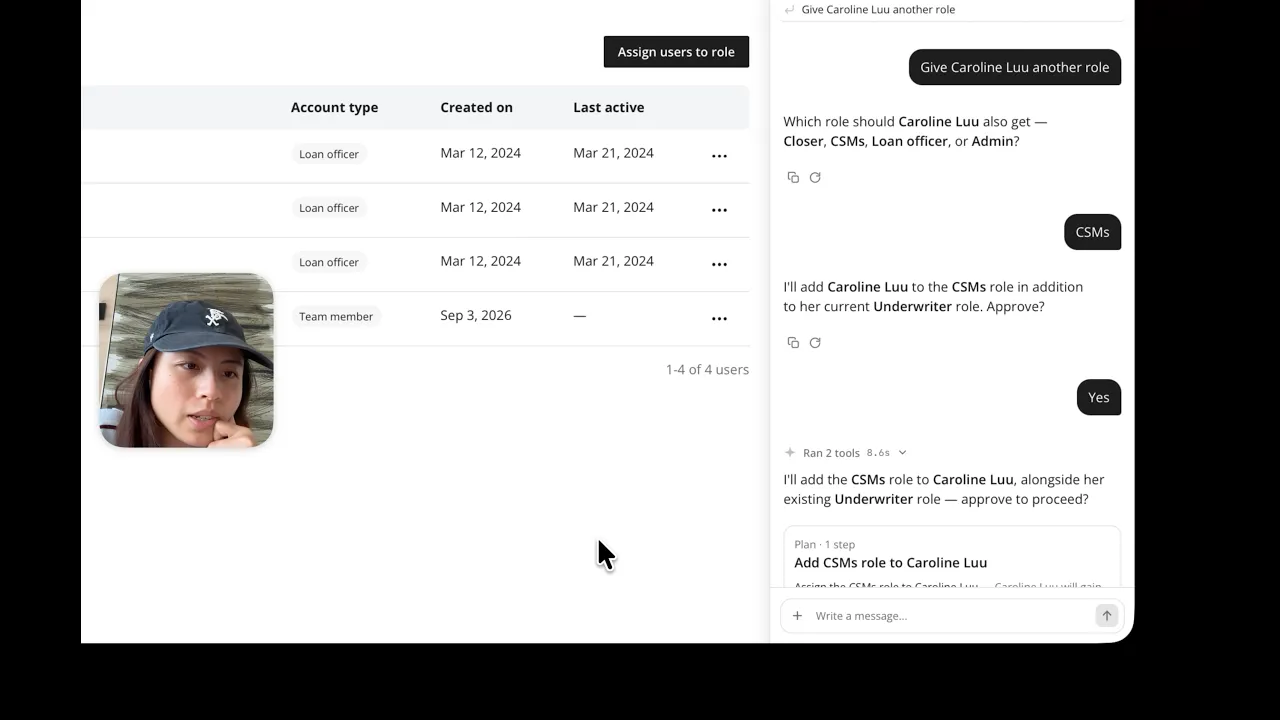
RBAC Admin Agent: Balancing AI with User Agency
How do you balance high automation with user agency? I paired high automation with high control and context by: (1) Over-communicating states, (2) Safeguards like undo / interrupting interactions, and (3) Explicit approval by users with proposed plans before execution (key for auditing). I used a past project, RBAC Admin User Management, to explore this tension and build an agent layer to fine-tune application.
Abridge hackathon: Agent for discharge planning
Worked with Dr. Jhonatan Munoz to create Inloop, an agent focused on discharge planning. It provides physicians with context needed to make discharge decisions by centralizing data into recommendations and providing discharge status in context of their working environments (Patient List and Patient Charts). We created this to submit and demo at the Abridge x Anthropic x Lightspeed hackathon at Shack15 in July 2026.
Published a Figma plugin for export and compression
Export One PDF solves the need to export slides from Figma and compress them into a single PDF for email service limits. I learned about text encoding and PDF delivery across email services. Created the icon and cover which features a porcelain stacking box created in Japan's Edo period by an anonymous potter.
Context in proximity on a bar chart using Cursor
Made an interactive bar chart using Cursor and Harvard Graduate's loneliness survey. The "loneliness epidemic" as named by our Surgeon General in 2024 is fascinating to me from a social behavior perspective, but I don't hear many people talking about it. I love the idea of revealing context in the right places, when the questions arise in one's sense-making. Accessible data through fun interaction.
Root to Route, Visualizing Immigrant Journeys through Storytelling using Lovable
Knowing where I come from grounds me as I take risks and continue my parents' stories. I made Root to Route to (1) document stories across people, time, and space, and (2) share it with others. I loved how you can see stories logged in the same place. The challenge was getting the map to pan and fill as the user moves across.
Workflow Testing using Conductor
Collage with transform responsive to scroll trigger and progress bar. Tried out Conductor with Opus, using screenshots and video to guide design direction and Inspect to guide debugging. Turned out quick and aligned with intent.
Opportunity Graph, visualizing options before deciding
For this PM copilot product, I created an interaction that suggests options or product opportunities, both parents and child, based on in-house documentation. The goal of the app was to de-risk product bets and guide junior product managers with prompts and data. Learned that the data richness is what makes it valuable.